Description
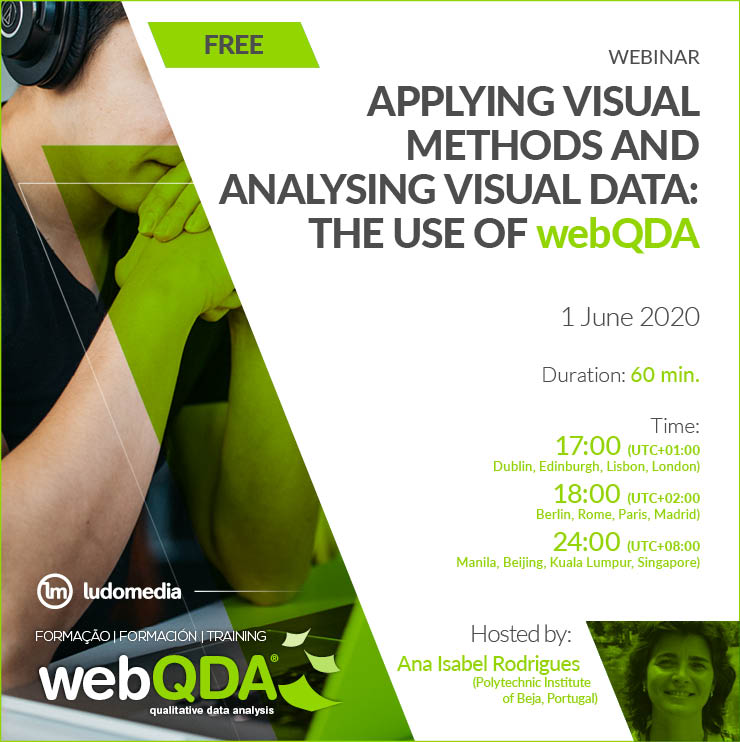
Webinar Applying visual methods and analysing visual data: the use of webQDA
In our contemporary society, images are omnipresent, since humankind is becoming increasingly image-based. It is exactly grounded on this assumption that all visual representation must potentially be considered for scientific studies of society. That is, image is everywhere and cannot be “apart” from research projects that focus on the study and understanding of the world we live in. In fact, visual research methods are usually claimed to be revelatory, since images can show things that other forms of analysis cannot. Because of this, researchers today have a set of data at their disposal with visual support, such as paintings, photographs, films, drawings and diagrams, among others, which have allowed the introduction of new interpretive elements that enrich qualitative approach and analysis. Much of qualitative research is based on texts (from field notes, descriptions, reflections), but since we are dealing with complex social situations, all data that might help us to understand it more deeply is most welcome. Images might reveal new insights and perspectives that are not accessible through the use of other data; conversations are full of verbal references to images and the use of words alone cannot express all the elements; the use of visual data can encourage participants to engage in research more creatively. We live in a ‘pictorial turn’ as claimed by some. The use of visual methods thus emerges as a field of study in qualitative research and aims to reach scientific validity within academia. The element of data analysis thereby emerges as a fundamental issue and the use of computer-assisted qualitative data analysis software (CAQDAS) packages has begun to offer interesting possibilities for visual qualitative data analysis.
In this line of thought, this webinar aims to:
. Define and understand the benefits of using a more ‘pictorial approach’ in qualitative research;
. Briefly explore and identify visual data methods and techniques (e.g. photo-elicitation, visual essay, etc.)
. Make participants think about the right questions when using a visual research approach: What is the role of visual data in my research? What type of visual method should I use? What type of visual data are important for my research? (Photos? Videos?) What source of visual data should I use and in what stage of my research? What qualitative software should I use? Or what visual analsysis technique should I use?
. Apply visual data analysis techniques (in particular content analysis) using webQDA, exploring its benefits in research projects;
. Identify and define all the stages of analytic strategy when applying content analysis to visual data (with the use of webQDA as an example)
This webinar is organized and conducted based on Rose’s rational: “Use your methodology to discipline your passion, not to deaden it” (Rose, 2016, p. xxiii)
REFERENCES
Rose, G. (2016). Visual methodologies: An introduction to researching with visual materials. London: Sage Publications Ltd.
________________
Ana Isabel Rodrigues has been a professor of tourism at the Polytechnic Institute of Beja (Portugal) since 1997. Her academic background focused on two main areas: tourism and communication: MSc in communication & tourism, ISCTE/Lisbon University Institute; PhD in tourism, Algarve University, Portugal. Her main research interests focus on communication and image, qualitative methods, visual-based methods, tourism education methodologies, experiential-based learning and CAQDAS. She has peer-reviewed tourism and visual qualitative research journals papers and book chapters and is a reviewer for several journals and member of the scientific committee of international conferences. More information about her research is available at https://www.researchgate.net/profile/Ana_Rodrigues103


Reviews
There are no reviews yet.